
Data science experiments management with Weights & Biases platform
Introduction
Probably every data scientist has come across a situation where you have created many different models, with different parameters or the entire architecture, and started experimenting.
Aside from the model architecture, you wanted to experiment with the choice of optimizer, learning rate, number of epochs, and so on. Thus, in fact, you will have many different experiments and it will become more and more difficult to structure the results obtained. In this article, we'll show you how to properly and conveniently manage and log your machine and deep learning experiments.
Today there are many utilities that allow you to conveniently manage your experiments, such as: Weights & Biases, MlFlow, Neptune, Comet.ml and others.
MlFlow is an open source platform for managing the machine learning lifecycle. This platform is great for single use, but not very suitable for use in large teams, or if you have a large number of experiments.
Neptune is a lightweight run management tool that helps you keep track of your machine learning runs. It offers 3 types of subscriptions, 2 of which are paid. If you are going to use this service individually, then you will get free access.
Comet is a machine learning platform for tracking, comparing, explaining and optimizing experiments and models. It also provides different subscriptions, but there is a limit on the maximum number of team members equal to 5.
We will show you how to effectively log experiments using one of these platforms, namely Weights & Biases.
Weights & Biases overview
W&B is a platform that helps data scientists to track their models, datasets, system information and many other features. With a few lines of code you can start tracking everything of these features. It is a paid utility for team use, but provides free access for personal and academic purposes.
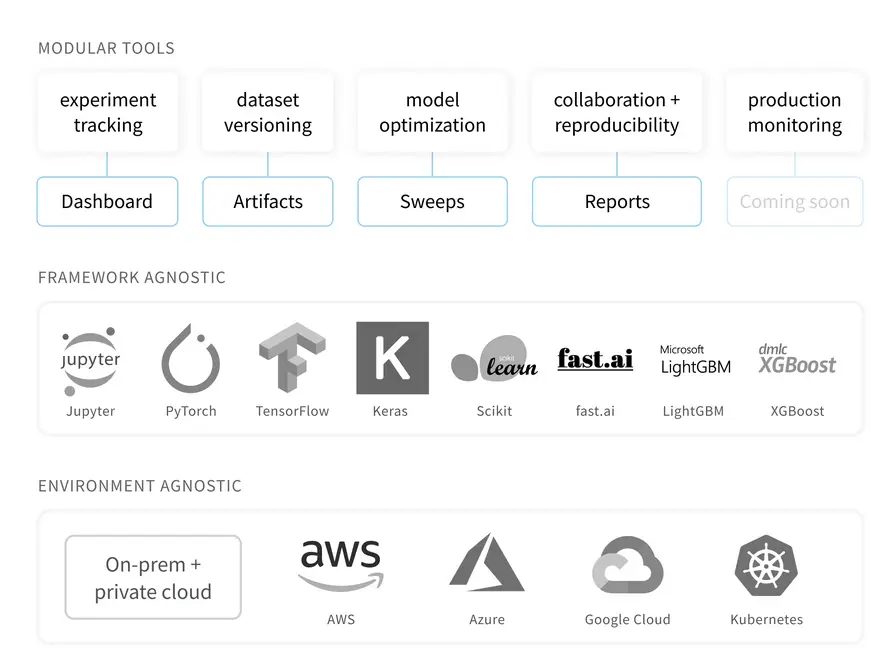
You can use W&B with your favourite framework, this platform supports many machine learning and deep learning frameworks, like tensorflow, keras, pytorch, sklearn, fastai and many others. All tracking information will be sent to the dedicated project page on the W&B website, from which you can open high quality visualizations, aggregate information and compare models or parameters.
One of the advantages of remotely storing the experiment’s information is that it is easy to collaborate on the same project and share the results with your teammates. W&B provides 4 useful tools:
- Dashboard: Experiment tracking
- Artifacts: Dataset versioning, model versioning
- Sweeps: Hyperparameter optimization
- Reports: Save and share reproducible findings
In our tutorial we will consider every one of these tools.
Tutorial
Try it on Google Colaboratory.
To start, we should create a free account on the W&B website, then let’s create a Jupyter-notebook with a simple Keras classifier model.
!pip install wandb -q
import wandb
Then you should open your terminal and write:
wandb login
You will get your API key.
Now let’s create a new project in W&B and set a config with hyperparameters for the first experiment.
project_name = 'first_steps'
group_name = 'cnn'
experiment_name = '2_conv'
wandb.init(
    project=project_name,
    group=group_name,
    name=experiment_name,
    config={
        "conv_1": 32,
        "activation_1": "relu",
        "kernel_size": (3, 3),
        "pool_size": (2, 2),
        "dropout": 0.3,
        "conv_2": 64,
        "activation_out": "softmax",
        "optimizer": "adam",
        "loss": "sparse_categorical_crossentropy",
        "metric": "accuracy",
        "epoch": 6,
        "batch_size": 32
    })
config = wandb.config
As you can see, config is a dictionary with the hyperparameters, also it may not be only a dictionary. You can download your own configs in .yaml format. wandb.init - this creates a new run in W&B and launches a background process to sync data.
The next step is loading data and defining a simple CNN model.
from wandb.keras import WandbCallback
mnist = tf.keras.datasets.mnist
(x_train, y_train), (x_test, y_test) = mnist.load_data()
our_model = cnn_mnist()
class_names = ['0', '1', '2', '3', '4', '5', '6', '7', '8', '9']
our_model.fit(x_train, y_train, epochs=config.epoch, batch_size=config.batch_size,
          validation_data=(x_test, y_test),
          callbacks=[WandbCallback(data_type="image",
          labels=class_names)])

wandb.finish()
We used the Keras callback to automatically save all the metrics and the loss values tracked in out_model.fit. Also WandCallback() class supports a number of options, like data_type, labels, etc. W&B supports only images in data_type.
Dashboards
Now we can look at the results obtained. The run we have executed is now shown on the left side, in our project with the group and experiment names we listed. We have access to a lot of information that W&B has automatically recorded.
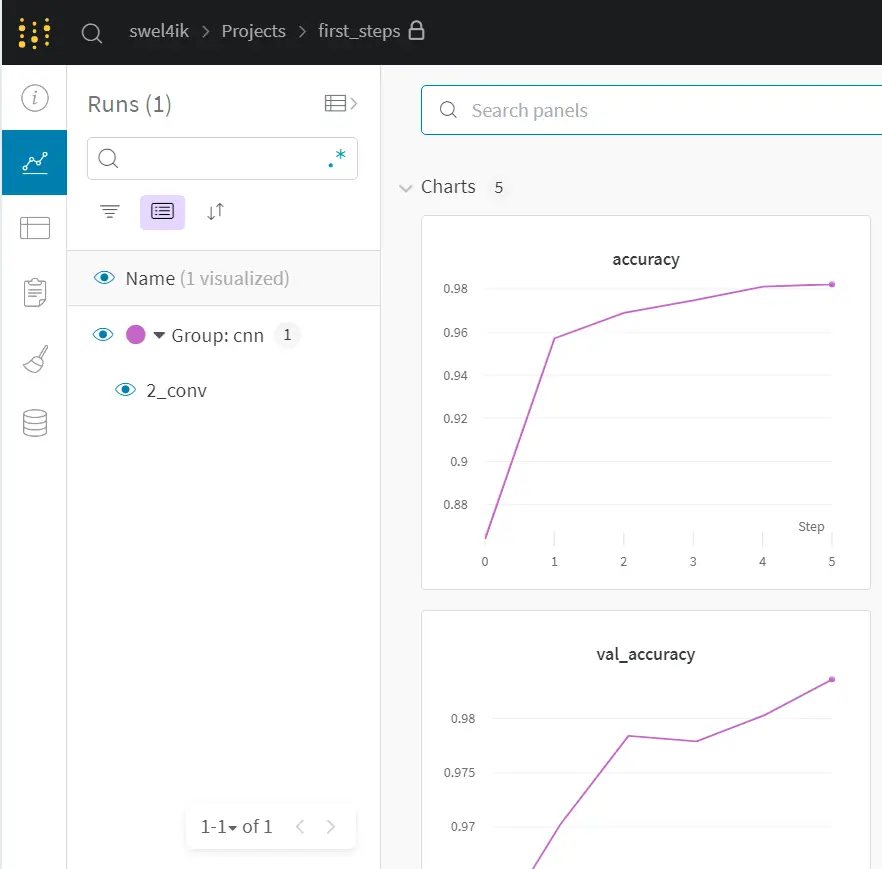
We have a several sections like:
Charts - contains information about losses, accuracy, etc. Also it contains some examples from our data.
System - contains system load information: memory usage, CPU utilization, GPU temp, etc. This is very useful information, because you can control the usage of your GPU and choose the optimal batch size.
Model - contains information about our model structure (graph).
Logs - include Keras default logging
Files - contains all files that were created during the experiment, such as: config, best model, output logs, requirements, etc. The requirements file is very important, because in order to recreate a specific experiment, you need to install specific versions of the libraries.
All of these logs and files are needed to recreate the experiment, and the data scientist can now automate the creation of such logs and files, helping to save time.
Sweeps
W&B provides tools for hyperparameters and model optimization named sweeps. Sweeps give you powerful levers to configure your sweeps exactly how you want them, with just a few lines of code. If you want to learn more about hyperparameters optimization techniques, you can check out our article Efficient Hyperparameter Optimization with Optuna Framework. It goes into more detail about optimization mechanisms.
First, you should define a config with hyperparameters which you are going to optimize. Also, you should choose a hyperparameter optimization strategy - random search or grid search, then choose a metric, which you are going to optimize.
sweep_config = {
    'method': 'random', #grid, random
    'metric': {
      'name': 'accuracy',
      'goal': 'maximize'
    },
    'parameters': {
        'epoch': {
            'values': [5, 10]
        },
        'dropout': {
            'values': [0.3, 0.4, 0.5]
        },
        'conv_1': {
            'values': [16, 32, 64]
        },
        'conv_2': {
            'values': [16, 32, 64]
        },
        'optimizer': {
            'values': ['adam', 'nadam', 'sgd', 'rmsprop']
        },
        'activation_1': {
            'values': ['relu', 'elu', 'selu','sigmoid']
        },
        'kernel_size': {
            'values': [(3, 3), (5, 5), (7, 7)]
        },
    }
}
Then let’s create a sweep:
sweep_id = wandb.sweep(sweep_config, entity=user_name, project="first_steps")
def train():
    # Default values for hyper-parameters we're going to sweep over
    config_defaults = {
        "conv_1": 32,a
        "activation_1": "relu",
        "kernel_size": (3, 3),
        "pool_size": (2, 2),
        "dropout": 0.1,
        "conv_2": 64,
        "activation_out": "softmax",
        "optimizer": "adam",
        "loss": "sparse_categorical_crossentropy",
        "metric": "accuracy",
        "epoch": 6,
        "batch_size": 32
    }

    # Initialize a new wandb run
    wandb.init(config=config_defaults)

    # Config is a variable that holds and saves hyperparameters and inputs
    config = wandb.config

    model = cnn_mnist(config=config)

    model.fit(x_train, y_train, epochs=config.epoch, batch_size=config.batch_size,
          validation_data=(x_test, y_test),
          callbacks=[wandb.keras.WandbCallback()])
The sweep calls this function with each set of hyperparameters.
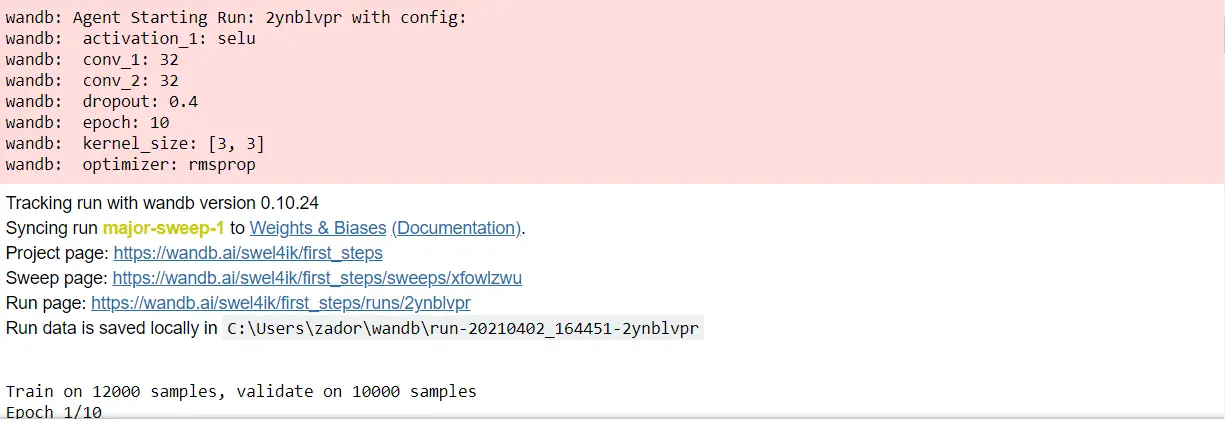
Now we can run it and get output like that.
wandb.agent(sweep_id,train)
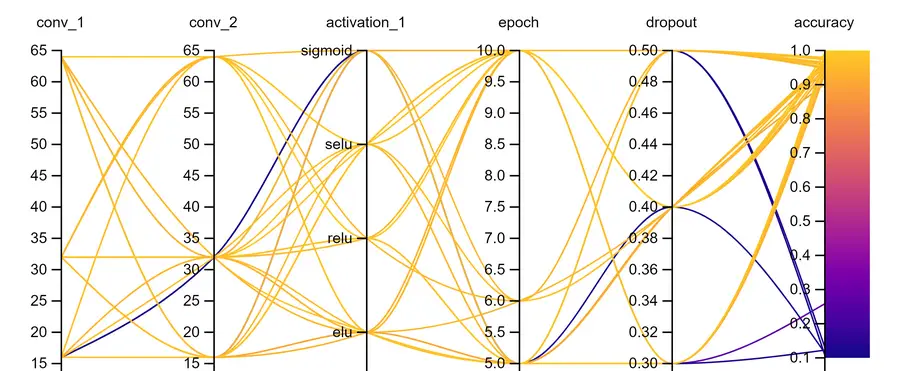
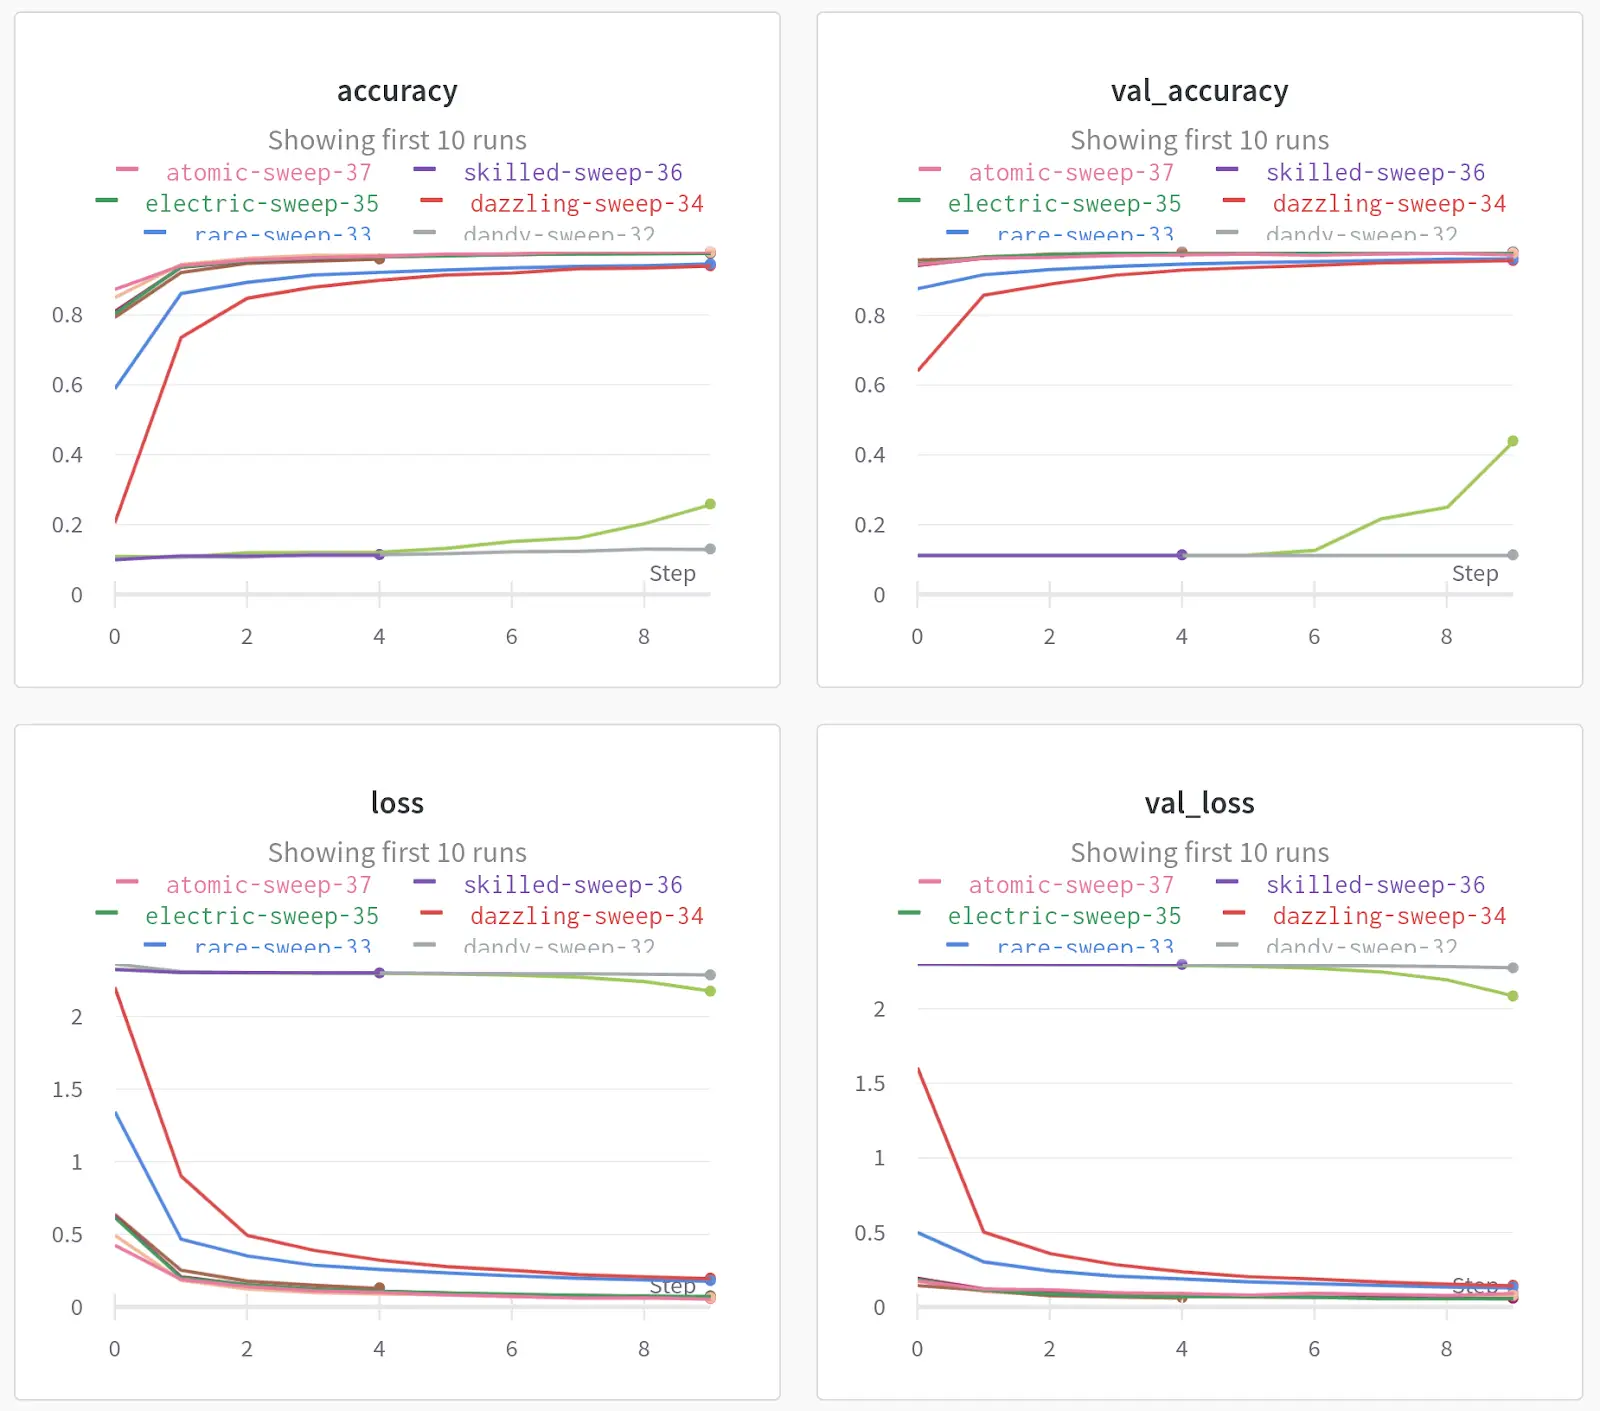
Let’s look at the results of each sweep. And choose the most appropriate hyperparameters for our model. You can see how the accuracy changed depending on the set of parameters we are interested in. In addition to these charts, you can build the charts that seem most important to you, you can also log the predictions of the model and thus find examples on which the model makes mistakes most often.
Artifacts
In addition to Sweeps and Charts, W&B also provides a useful utility that allows you to log your data and models, it is called Artifacts. In this context, artifacts are produced objects - the outputs of processes - datasets and models. We'll show you how to use artifacts in case of dataset logging from our previous example.
At start, let’s load a raw dataset, then create a new Artifact.
def load_and_log():
    with wandb.init(project=project_name, job_type="load-data") as run:

        datasets = load_data()
        names = ["training", "validation", "test"]

        # Artifact
        raw_data = wandb.Artifact(
            "mnist-raw", type="dataset",
            description="Raw MNIST dataset, splitted",
            metadata={"source": "keras.datasets.mnist",
                      "train_data": len(datasets[0].x),
                      "valid_data": len(datasets[1].x),
                      "test_daata": len(datasets[2].x)})

        for name, data in zip(names, datasets):
            # Save our datasets
            with raw_data.new_file(name + ".npz", mode="wb") as file:
                np.savez(file, x=data.x, y=data.y)
        #save Artifact
        run.log_artifact(raw_data)

load_and_log()
There are some good practices for Artifact’s management:
- job_type should be descriptive and corresponds to a single step of your pipeline. (we separate out loading data from preprocessing data)
- Name of the Artifact should be descriptive
- Type of the Artifact should be descriptive and simple (dataset or model)
- Try to write a sufficient information about your Artifact in metadata file
- All these practices will help you and your teammates to properly organize your pipeline structure.
If we go to the run page, go to the Artifacts tab, we will see the following:
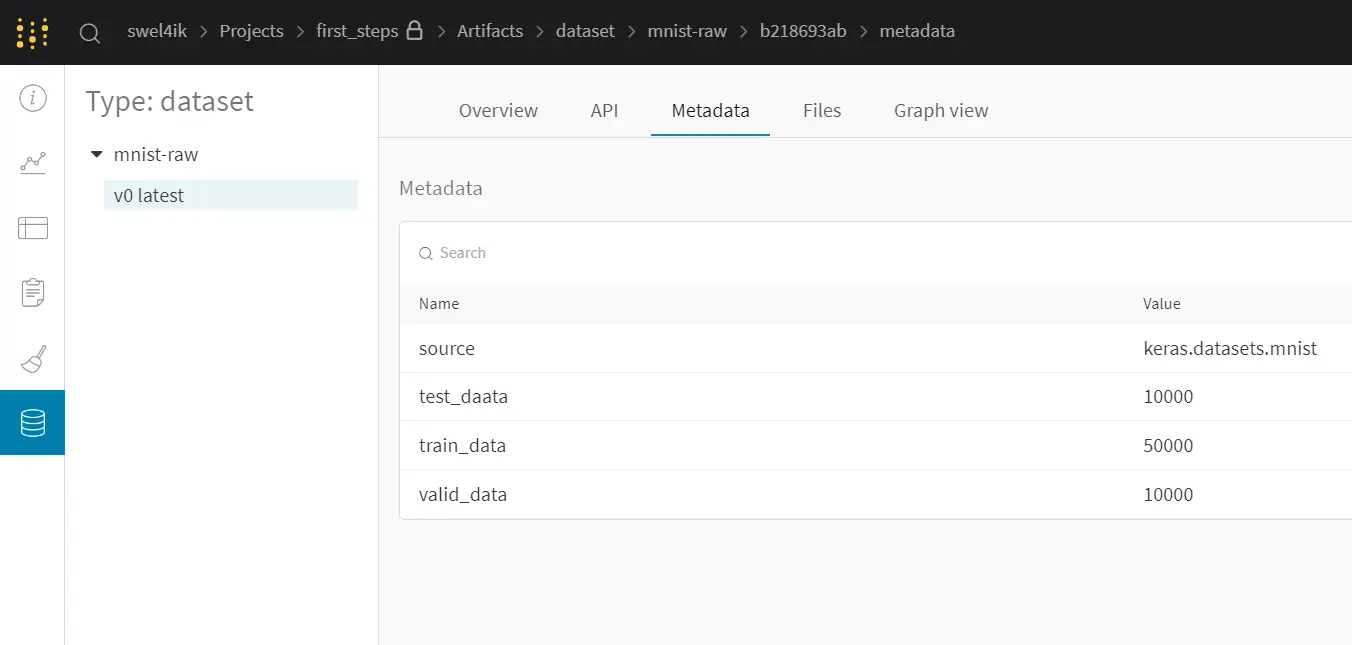
We got an output Artifact (mnist-raw) in our project. This Artifact contains:
- Metadata - description of current Artifact, in our case, here is description about our dataset (source, split size).
- Files - contains datasets
- Graph view - graph of Artifacts (inputs, outputs, processes)
Now let’s add a new Artifact, which will describe data preprocessing.
def preprocess_and_log(preprocess_steps):

    with wandb.init(project=project_name, job_type="data_preprocessing", name="preprocess_simple") as run:

        processed_data = wandb.Artifact(
            "mnist-preprocessed", type="dataset",
            description="Preprocessed MNIST dataset",
            metadata=preprocess_steps)

        # which Artifact we will use
        raw_data_artifact = run.use_artifact('mnist-raw:latest')

        # download Artifact
        raw_dataset = raw_data_artifact.download()

        for split in ["training", "validation", "test"]:
            datafile = split + ".npz"
            data = np.load(os.path.join(raw_dataset, datafile))
            raw_split = Dataset(x=data["x"], y=data["y"])
            processed_dataset = preprocess_dataset(raw_split, **preprocess_steps)

            with processed_data.new_file(split + ".npz", mode="wb") as file:
                np.savez(file, x=processed_dataset.x, y=processed_dataset.y)

        run.log_artifact(processed_data)
First, create a new Artifact, name it. Then we should choose the Artifact, which we will use (mnist-raw:latest). After that, we use preprocess_dataset for each data split and save the results in the new Artifact.
Finally we can run it.
steps = {"normalize": True,
         "expand_dims": True,
         "to_categorical" : True}
preprocess_and_log(steps)
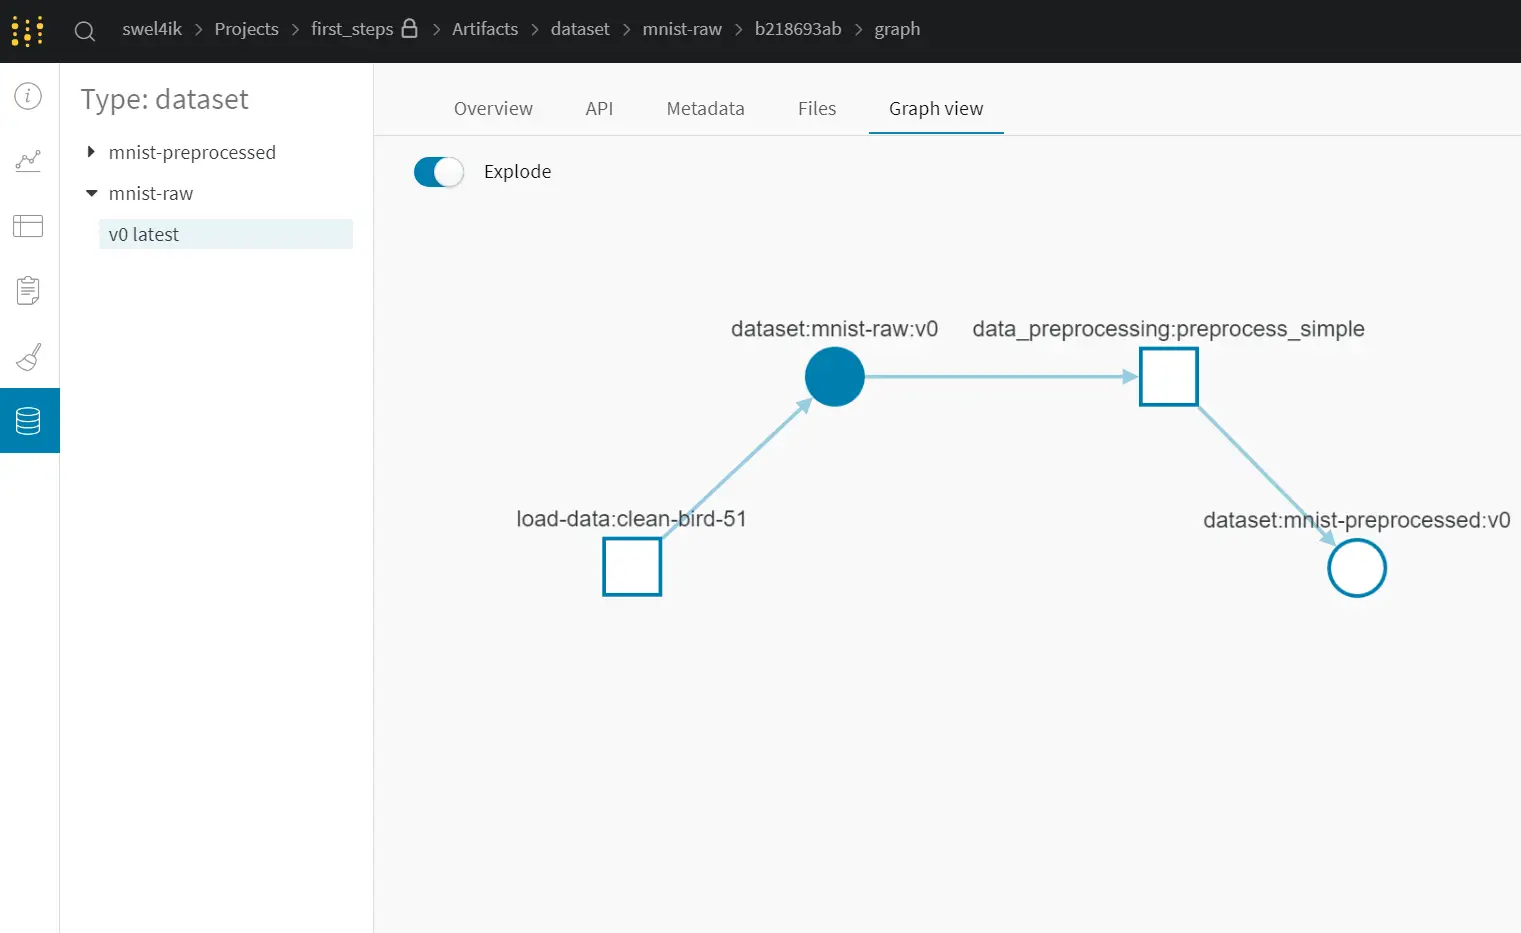
As you can see now we got 2 Artifacts: mnist-raw and mnist-prepocessed. Graph view presents a user-friendly interface of your pipeline steps: rectangles - our input / output Artifacts, circles - processes between Artifacts. With the help of a Graph view, you can easily track how your pipeline has changed in the course of work.
Reports
With the help of reports you can easily organize visualizations, describe your findings, and share updates with your team. In the report, you can indicate whatever you think is necessary, various graphics, dependencies, plans for the future. You can edit your reports with Latex or Markdown.
It's very simple to create a new report, you should go to your workspace in wandb.ai and click Create Report. You can create a report for one project or for one group, or you can create a cross-project report to compare runs from two projects. W&B provides a few templates of reports, or you can create your custom blank report.
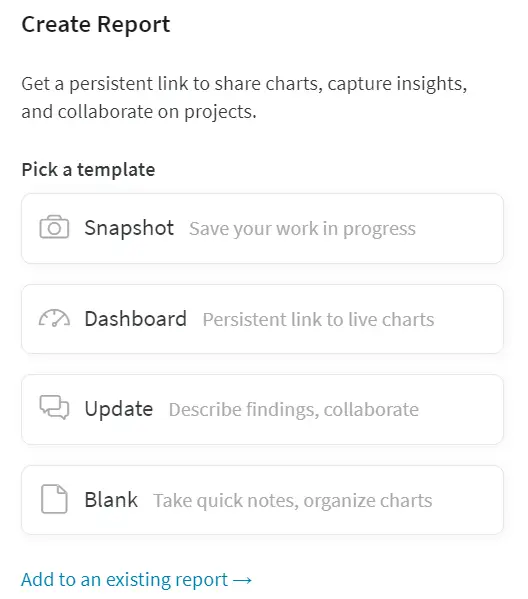
Snapshot adds the current date/time to the title, and adds a filter to the run set, which means only runs created before the current time are included in the snapshot.
Dashboard titles the report “Project Dashboard” and adds a filter to match exactly the current set of selected runs.
Update titles the report “<today’s date> Project Update” and filters to the exact set of runs that were selected in the workspace.
Blank gives you the space to add a fresh panel grid and visualizations, or just write some notes to yourself.
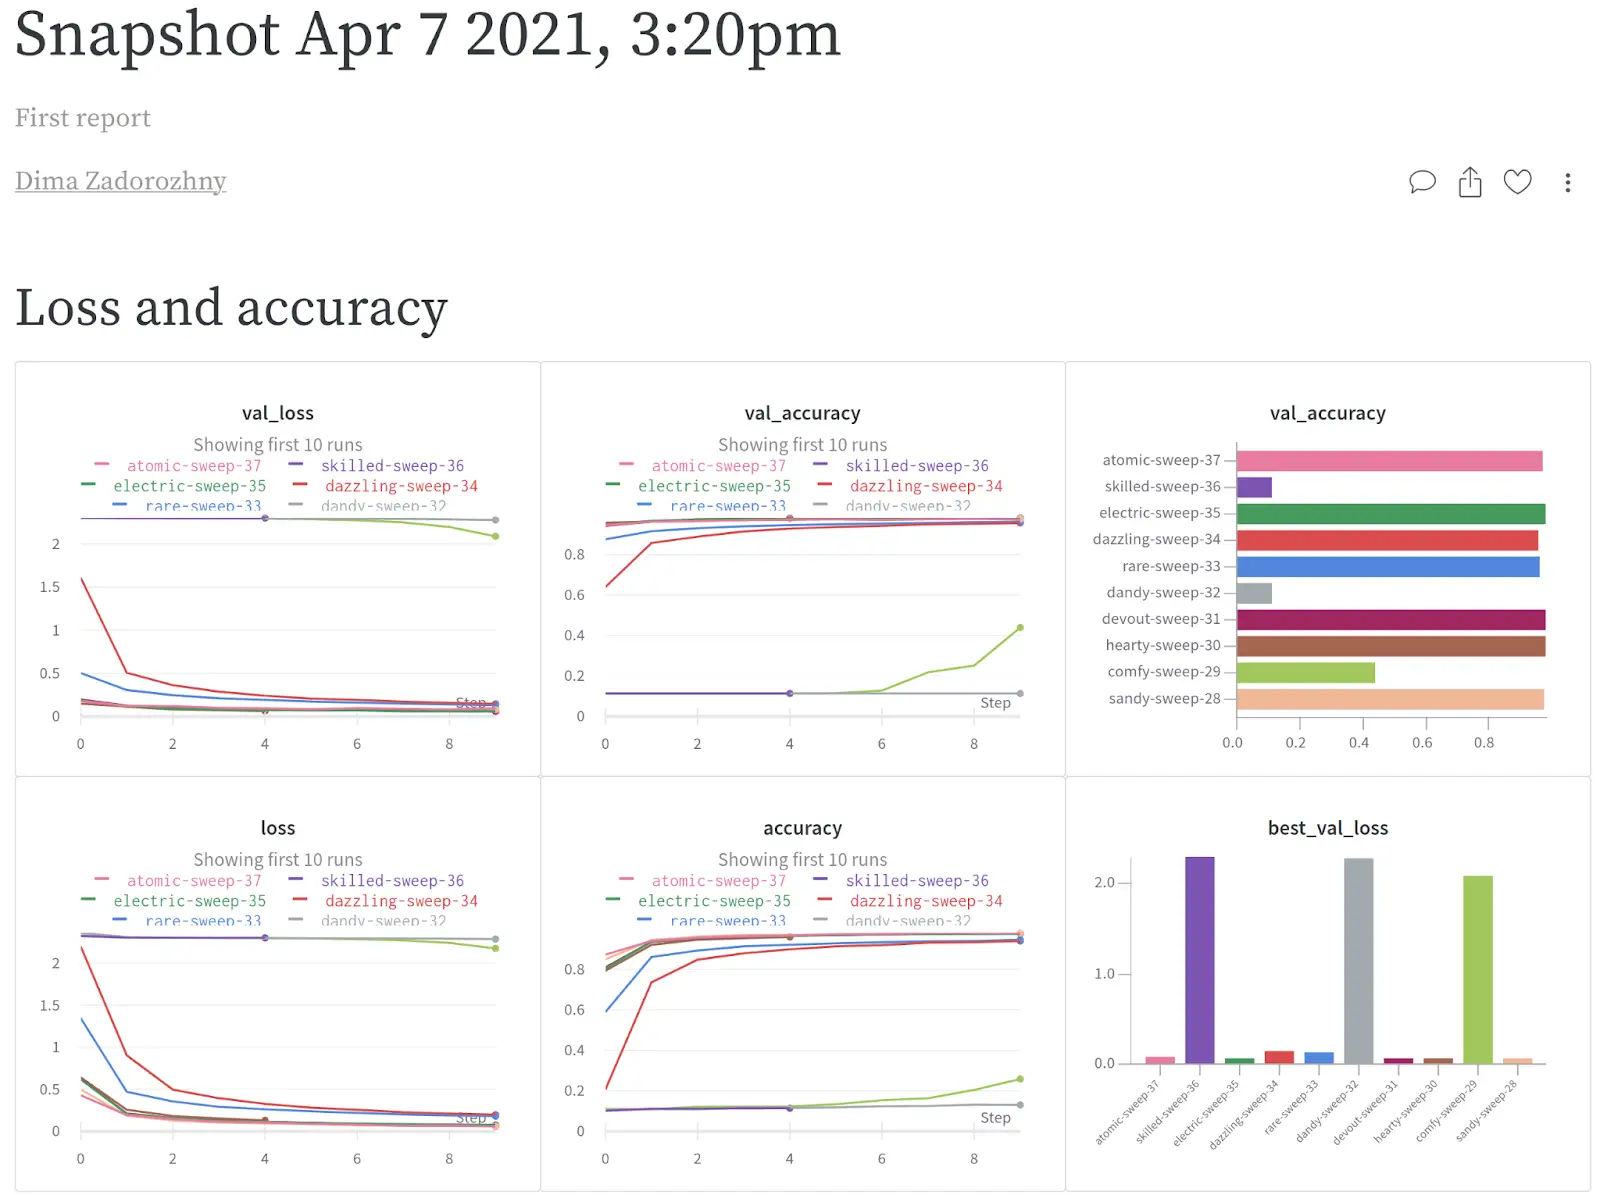
Now we can share the results with our team. The use of Reports helped us to summarize the information received about today's experiments. In the future, we will not need to separately search for the results of each experiment, it will be enough to open the corresponding Report.
Conclusion
In this article, we have shown how you can effectively manage and log your experiments with Weights & Biases. We have reviewed the main tools of this platform, for an advanced study you can refer to the official documentation. We hope this guide will be useful for your future work.

